Your Homepage Has an OG Image. Do Your Product Pages?
In a February 2026 sample, 70 domains declared an OG image on the homepage while an HTTP-200 product page lacked it. See the paired data and a practical coverage check.
A homepage scan answers a question about the homepage. It cannot establish that your product pages declare their own preview images.
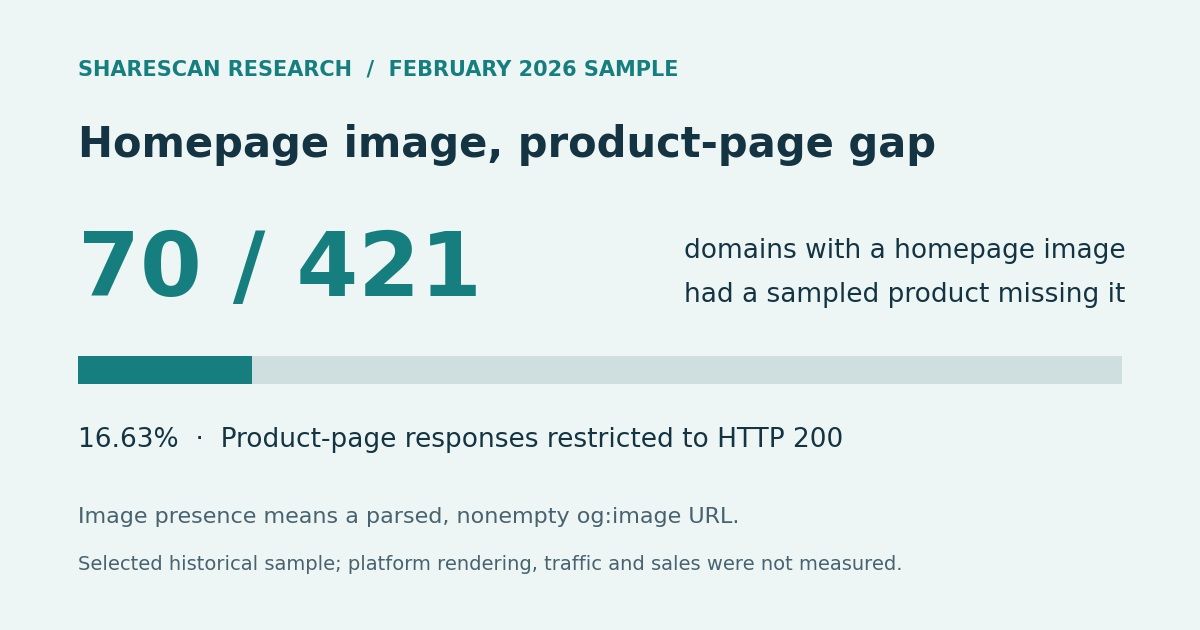
In ShareScan's February 2026 sample, 70 of 421 domains whose homepage declared an og:image URL had at least one sampled product page that returned HTTP 200 but lacked that field. That is 16.63% of the homepage-image-present group. Each comparison pairs the homepage with product checks from the same selected crawl.
This is a metadata-presence finding, not a count of broken social cards. We did not measure platform rendering, clicks or sales. The selected cohort is not representative of all ecommerce, and the observations describe February 2026 rather than these sites today.
Check your homepage and a few product pages in a free scan.
The practical implication is straightforward: when your team shares product links, include product URLs in the check. Below are the paired results, the limits of the comparison and a small coverage exercise you can apply to your store.
Compare pages within the same crawl
The February snapshot includes 647 domains and 72,716 product checks. For this analysis, each domain contributes one recorded homepage check and the product checks from the same selected crawl. There is no comparison between one site's homepage and another site's products.
An earlier audit reconciled those selected crawls with the archived records and historical scores. Snapshot membership does not store crawl IDs directly: the reconstruction selected each member's last completed crawl at the cutoff and verified that selection. The dated methodology notes explain the cohort and coverage exceptions.
Here, image present means the crawler recorded a parsed, nonempty og:image URL. It does not establish that the image was fetchable, appropriate for the page or displayed by a platform. The Open Graph protocol defines the image in relation to the page's object; a field on the homepage is not evidence of a field in a different page's response.
Across all saved product responses, the paired table is:
| Homepage image URL | At least one sampled product missing image URL | No sampled product missing image URL | Domains |
|---|---|---|---|
| Present | 72 | 349 | 421 |
| Absent | 157 | 69 | 226 |
| Total | 229 | 418 | 647 |
The top-left cell is the gap of interest: 72 of 421, or 17.10%. Using every snapshot domain as the denominator gives 72 of 647, or 11.13%. Those percentages answer different questions. Neither is the percentage of all ecommerce sites with a broken preview.
The bottom-right cell matters too. On 69 domains, the recorded homepage lacked the field while none of the sampled products did. A homepage result can therefore miss a product-page issue or suggest a field is absent more broadly than the checked responses establish.
Compare only HTTP-200 product responses
An HTTP error response can lack metadata for reasons unrelated to the intended product template. We repeated the pairing using only product-page responses with HTTP 200. All 647 recorded homepages returned HTTP 200, and every domain retained at least one product check after this filter.
| Product responses included | Domains with a homepage image | Domains with at least one product missing the field | Share of homepage-image-present domains |
|---|---|---|---|
| All saved responses | 421 | 72 | 17.10% |
| HTTP 200 only | 421 | 70 | 16.63% |
The filter removes two domains from the gap group. It leaves the main observation intact: a declared homepage image did not establish image-field coverage on the sampled product pages that successfully returned HTTP 200.
For those 70 domains, 2,518 of 7,652 retained product checks lacked the image field, or 32.91%. This is a conditional product-check proportion within that group. It is not 32.91% of all product pages in the snapshot, and it does not count confirmed platform failures.
The complete historical cohort includes 636 domains labeled retail ecommerce, eight unknown and three marketplaces. Repeating the calculation for the retail-label subset alone gives 69 of 415 homepage-image-present domains in the HTTP-200 comparison, also 16.63% after rounding. The downloadable tables keep the two scopes separate.
“At least one” depends on how much you checked
A domain with more sampled products has more opportunities to show a missing field. In the unfiltered 72-domain gap group, the product samples range from 4 to 149 checks, with a median of 101. In the 349-domain group with a homepage image and no sampled product missing it, they range from 7 to 149, with a median of 114.
These sample-size summaries do not adjust for different site structures or sampling coverage. Product classification was heuristic, and the records are a bounded sample rather than a complete inventory of every site's products.
The missing fields were not evenly distributed within the gap group either. For those 72 domains, the product-weighted missing-field rate is 31.73%; the mean of the individual domain rates is 32.68%, and their median is 11.35%. The broader signal analysis explains why product-weighted and domain-weighted summaries differ.
This comparison does not identify a cause. Separate page templates, missing CMS fields and conditional metadata generation are useful things to investigate on your site. The saved observations alone cannot establish which of them caused a particular result.
Check the product routes your team actually shares
Build a small, deliberate list before expanding the audit. Include the homepage as one comparison point, plus product URLs that exercise different output paths. For example:
| URL to select | What to compare |
|---|---|
| Homepage | Does its response declare the intended site-level image? |
| Product with a custom share image | Does the product response declare that image, rather than a store-wide fallback? |
| Product using the normal product image | Is the expected image mapped into the public metadata? |
| Product from another template or collection | Does that route produce its own metadata? |
| Recently changed product | Does the published response reflect the CMS change? |
| Variant URL, when your store supports it | Does the response and chosen image match the intended sharing behavior? |
These are selection criteria, not evidence that every store uses these mechanisms. Record why each URL is included and which templates remain unchecked. If a route returns an error or redirects to a different page, keep that outcome visible.
For each selected URL, work through four separate checks:
- Read the response. Record the final page URL, HTTP status and returned
og:imagevalues. Compare the product's response with the homepage response. Do not infer the product's output from shared branding or a similar browser layout. - Fetch the image. Request the declared image and inspect its status, content type and actual content. A nonempty tag is a starting point, not a successful image fetch.
- Check the intended choice. A publicly accessible generic store image can pass structural checks while being the wrong choice for a particular product. Compare the declared image with the product or campaign you intend to share.
- Inspect the target platform. Check the card where your team shares the link. Metadata checks do not prove how a platform selects alternatives or uses cached values. The missing-image guide separates absent markup, delivery failures, image choice and caching.
You can use the Link Preview Checker for an explicit list of up to ten public URLs. Record the pages the report actually checked; a sample does not certify an entire catalog. If several products share a finding, inspect their template and data before assuming one common cause.
After a fix, repeat the same selected URLs and keep a few previously healthy pages as controls. Then expand coverage using the website audit walkthrough, which covers inventories, discovery failures and checks across multiple templates.
For recurring follow-up, the report offers optional confirmed email or explicitly activated Slack monitoring for up to ten report pages. Broader coverage and scheduled checks use a verified workspace through Open Graph monitoring, within the chosen plan's limits.
Download the paired tables
The paired dataset and codebook include both 2×2 tables for each domain scope, the HTTP-200 sensitivity results, product-sample summaries and an offline consistency verifier. Run python3 verify.py after extraction. Domain names, individual URLs and raw page records are omitted.
The verifier checks file integrity and arithmetic across the aggregates. It cannot independently reconstruct the private source observations, within-domain distributions or crawl-to-snapshot mapping. Keep those limits with any reused figures.
Suggested attribution: ShareScan Social Preview Reliability Index, February 2026 snapshot; paired homepage and sampled product checks from 647 included domains. For the 70-of-421 result, also state that product-page responses were restricted to HTTP 200 and the denominator includes only domains whose homepage declared an image URL.
Related articles
Put the guide into practice
Check the links your team shares.
Check preview images, titles and descriptions on up to 10 pages. Review the findings, then choose what to monitor.
No account or card. Choose weekly follow-ups by email or Slack after your scan.